To go along with the release of Haxe 4.0.0-rc.2, we’ve just released version 2.8.0 of the Haxe extension for Visual Studio Code. The full changelog is here.
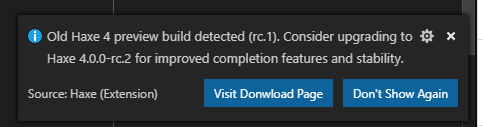
The first thing you’re probably going to notice is the update notification for the rc.2 release:
Vshaxe 2.8.0 also updates the eval debugger introduced in 2.6.0 to be compatible with rc.2 (it’s no longer compatible with rc.1 or earlier!). Thanks to @Simn’s efforts, there have been major improvements to the debugging experience, such as:
-
“step over” being handled much more smoothly
-
support for threading
-
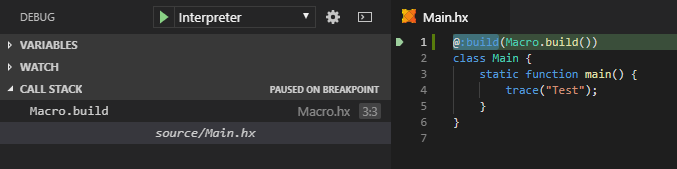
macro entry points in the call stack - for init macros, it shows the
--macroargument: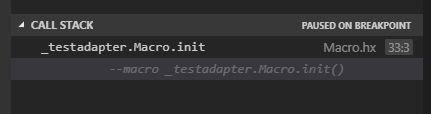
for other macros, the call stack item is even clickable and shows the location of the call:
-
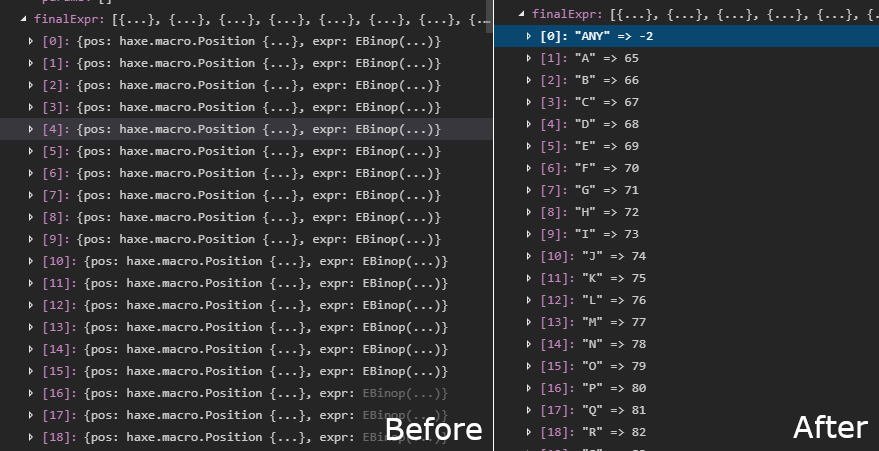
pretty-printing of
haxe.macro.Exprinstances: -
and many other minor improvements and fixes
Another major improvement that’s worth mentioning: parser errors are now shown in diagnostics. Technically this was already part of vshaxe 2.7.0, but required Haxe dev to come into effect.
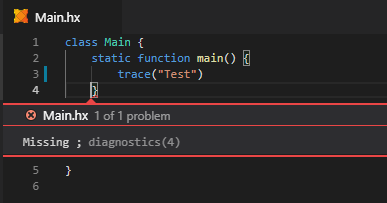
I can’t count the number of times I’ve hit “compile” only to have the compiler yelling at me about a missing semicolon. With auto-save and diagnostics you easily get into the mind-set of “if nothing is red, it should compile”, but that just wasn’t true for parser errors. No longer!
Note that there’s still a category of errors that are not shown in diagnostics, but this should happen less frequently. There are plans to improve this.
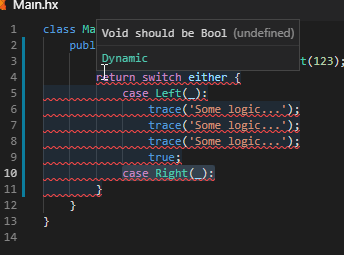
Similarly, Haxe 4.0.0-rc.2 improved the ranges on some errors. Previously you would often see entire switches being marked red:
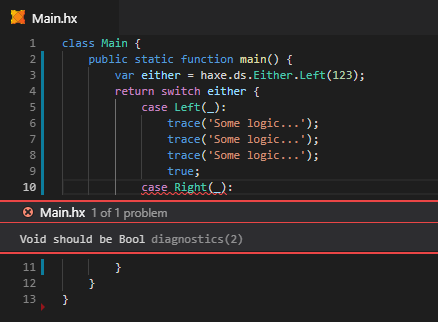
Instead, only the offending case is now highlighted:
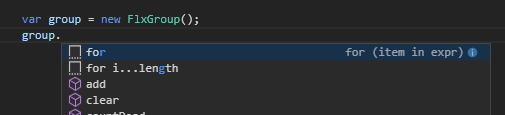
Finally, postfix for-loop generation is no longer hardcoded to a few specific types (Array, Map) with rc.2, meaning it works with custom types that implement iterator() or keyValueIterator()!
PS.: vshaxe is about to hit 100k downloads at the time of writing. 