Suitable Workflow For Debugging C++ Within IntelliJ?

Hello Eric,

thank you for your patience.

I think, in small steps, we get ahead…

I have done, what should be done first, when the mashine does not behave as expected: I have pulled the plug and started from the beginning.

Now, the debugger initializes succesfully (at least I get the according message).

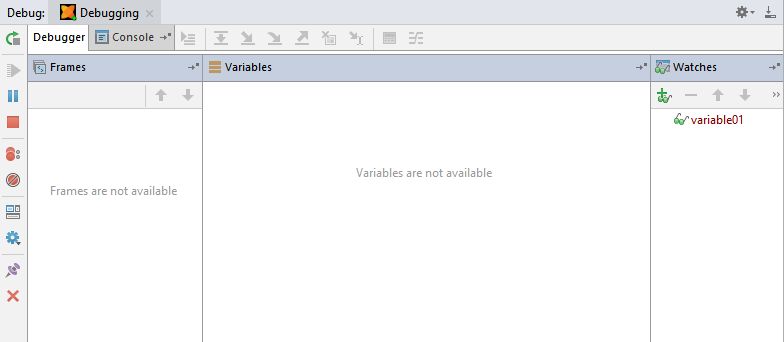
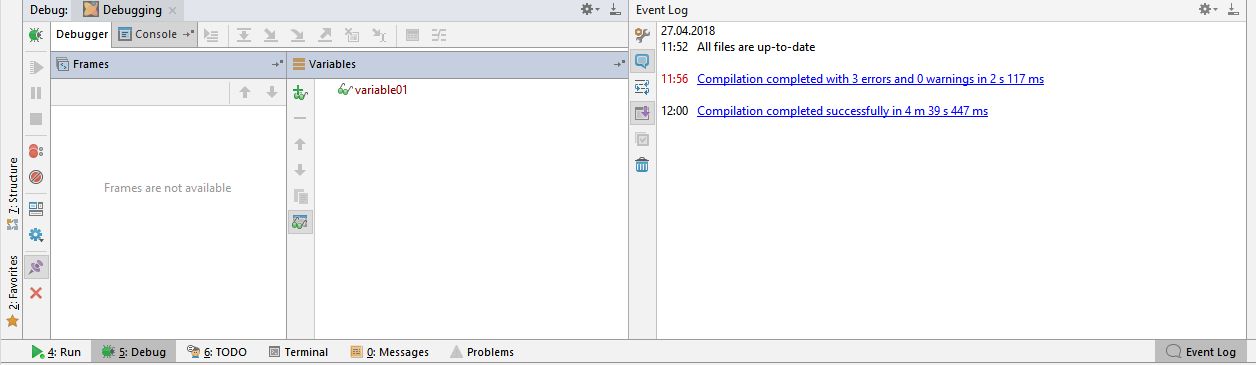
But the debugger does not show any frames nor the variables observed…

When I look at the “Problems” window, the following message appears:

Information:Debugging loop failed: java.net.SocketException: socket closed

And here is the debugger console message:

_C:/HaxeToolkit/haxe/haxelib.exe run lime run E:/_IO/HAXE/zzzExperimentalProjects/debugging/project.xml windows -verbose -Ddebug -debug -args -start_debugger -debugger_host=localhost:6972 -Ddebug

[ lime logo as ascii art ]

Lime Command-Line Tools (6.2.0)

Initializing project…
_Using project file: E:/_IO/HAXE/zzzExperimentalProjects/debugging/project.xml
Reading Lime config: C:\Users\loxog.lime\config.xml
Using target platform: WINDOWS

Running command: RUN
- Changing directory: Export/windows/bin/
- Running command: Debugging.exe -start_debugger -debugger_host=localhost:6972 -Ddebug -verbose -livereload
[lime.app.Preloader] Preloading asset library
[lime.app.Preloader] Loaded asset library [1/1]
[lime.app.Preloader] Preload complete

Of cause, I have googled the error message above (“Problems”) and I have tried out anything, I could imagine…

So I am still very grateful for your help.

Kind regards
Arnim

Dear Community,

I have tweaked the settings again and could eliminate some mistakes I have overseen.

Now I am one step further and the debugging socket seems to be established successfully.

But the debugger still does not work.

The following output is given:

Lime Command-Line Tools (6.2.0)

Initializing project...
Using project file: E:/_IO/HAXE/_zzzExperimentalProjects/debugging/project.xml
Reading Lime config: C:\Users\loxog.lime\config.xml
Using target platform: WINDOWS

Running command: RUN
- Changing directory: Export/windows/bin/
- Running command: Debugging.exe -start_debugger -debugger_host=localhost:6972 -Ddebug -verbose -livereload
Main.hx:28: arg: -start_debugger
Main.hx:28: arg: -debugger_host=localhost:6972
Main.hx:28: arg: -Ddebug
Main.hx:28: arg: -verbose
Main.hx:28: arg: -livereload
Debugger:Starting App side debugger support.
Debugger:Connected to debugging server at localhost:6972.
Warning: This program was not compiled with the HXCPP_DEBUGGER flag set, debugging not supported.
Main.hx:76: variable01: 13
Main.hx:77: variable02: Great
Main.hx:78: variable03: 1.3
[lime.app.Preloader] Preloading asset library
[lime.app.Preloader] Loaded asset library [1/1]
[lime.app.Preloader] Preload complete

What has raised my attention was the sentence:

Warning: This program was not compiled with the HXCPP_DEBUGGER flag set, debugging not supported.

When I set the ‘HXCPP_DEBUGGER’ define in the project.xml a cascade of errors occur, the compiler stops and the socket is disconnected…

And this is, what the debugger pane looks like when the connection is said to be established:

What am I doing wrong?
Does anybody have an idea?

Kind regards
Arnim

Studying the idea.log I have found three error messages that apparently are warnings about the logging binding…

I don’t think, that they have an immanent effect nor that they concern this issue of mine…

2018-05-07 12:40:14,263 [4948508] INFO - j.compiler.server.BuildManager - BUILDER_PROCESS [stderr]: SLF4J: Failed to load class “org.slf4j.impl.StaticLoggerBinder”.
2018-05-07 12:40:14,264 [4948509] INFO - j.compiler.server.BuildManager -
BUILDER_PROCESS [stderr]: SLF4J: Defaulting to no-operation (NOP) logger implementation
2018-05-07 12:40:14,264 [4948509] INFO - j.compiler.server.BuildManager -
BUILDER_PROCESS [stderr]: SLF4J: See SLF4J Error Codes for further details.

So I still have no idea of how to resolve the problem…

So I think I should concentrate on the HXCPP_DEBUGGER flag:

Warning: This program was not compiled with the HXCPP_DEBUGGER flag set, debugging not supported.

I have searched the keyword ‘HXCPP_DEBUGGER’ in the hxcpp-debugger library.

I found exactly one use (at least this one is visible).

It is the position, the message above is printed out and the process is ended (like an error message thas is thrown):

#if !HXCPP_DEBUGGER
Sys.println("Warning: This program was not compiled with the " +
“HXCPP_DEBUGGER flag set, debugging not supported.”);
return;
#end

When I have commented it out, it stops at a deque, that is popped.

gStartQueue.pop(true);

So apparently the multi-threading is waiting for something to occur that can’t occur. So probably for the same reason the HXCPP_DEBUGGER flag is not set.

On the other hand, I have tried any possible combination of handing over the specific HXCPP_DEBUGGER flag:

  • via Project Structure/ module/ Haxe/ openFl arguments
  • via project.xml
  • via alternative Project Structure/ … / “Compile-with”-settings

As you assume, with no satisfying results.

Who of you is using the haxeToolKitt-plug-in for IntelliJ and debugs C++ targets with it?

I haven’t found any example for C++ debugging in the web. Is it a bug, that is not found, as nobody uses the plug-in for debugging C++?

If you consider the answer much to obvious to speak it out loud, you can even call me stupid for not seeing the seeming simplicity.

But slowly, I loose hope, getting it done.

Kind regards
Arnim

Hi Arnim,

Sorry for the delay. I was at the Haxe Summit and didn’t have time to check all of my usual channels.

HXCPP_DEBUGGER must be defined in your module. Add it to the field called “macros” (which is mis-named).

Also, if you are not using OpenFL, then there is a bug (that I just found) that will try to use the nme (and the nmml settings) to run the app. I just filed the bug and will get it fixed post-haste. (Module targets "HXML" and "Haxe Compiler" attempt to use "NMML" settings to run a debug session. · Issue #826 · HaxeFoundation/intellij-haxe · GitHub)

In the mean time, try using the OpenFL tab and defining HXCPP_DEBUGGER. Let me know how it goes.

-Eric

Hmm. Re-reading, it looks like you might have already tried that combination. :confused:
If you’re putting the flag in hxml, you need to use -DHXCPP_DEBUGGER.
On the module command line, you might also be able to add that flag.
In the module “macros,” it would be simply HXCPP_DEBUGGER.

You can also try the command-line debugger to see if you get any better results. The basic instructions are here: Getting started · HaxeFoundation/hxcpp-debugger Wiki · GitHub

-Eric

Hello Eric,

thank you very much for your reply.

Do you mean the Project Structure/ Modules/ Haxe/ Project Macros?

Like this?

IntelliJ%20--%20Project%20Structure

This has no effect. But I assume, that you are talking of a different “macros”.
(I know, that the compiler flags are added at this “macros” to make the code, they embrace, readable)

I have also set DHXCPP_DEBUGGER there…

I have also tried to hand over the -DHXCPP_DEBUGGER flag to the OpenFl Project XML as well:

Error: (c3fc099f_Debugger.obj) error LNK2005: “void __cdecl __hxcpp_execution_trace(int)” (?__hxcpp_execution_trace@@YAXH@Z) ist bereits in c3fc099f_Debug.obj definiert.
Error: (c3fc099f_Debugger.obj) error LNK2005: “void __cdecl __hxcpp_set_debugger_info(char const * *,char const * *)” (?__hxcpp_set_debugger_info@@YAXPAPBD0@Z) ist bereits in c3fc099f_Debug.obj definiert.
Error: (c3fc099f_Debugger.obj) error LNK2005: “class Dynamic __cdecl __hxcpp_dbg_checkedThrow(class Dynamic)” (?__hxcpp_dbg_checkedThrow@@YA?AVDynamic@@V1@@Z) ist bereits in c6adaa3b_ThreadPoolMessageType.obj definiert.
Error: (LIBCMT.lib(exe_main.obj)) error LNK2019: Verweis auf nicht aufgelöstes externes Symbol “_main” in Funktion ““int __cdecl __scrt_common_main_seh(void)” (?__scrt_common_main_seh@@YAHXZ)”.
Error: (ApplicationMain-debug.exe) fatal error LNK1120: 1 nicht aufgelöste Externe
Error:Error while running command
Error: (Command exited with an error code) 1
Error:Compilation failed

Similar Errors are thrown when I hand over -DHXCPP_DEBUGGER to that field ( OpenFl Project XML).

When I try to set it as

<haxedef name=“DHXCPP_DEBUGGER”/>

in the project.xml, the mashine tells me

Error: (Type not found) DHXCPP_DEBUGGER

Maybe the answer is one step away, when I find the module “macros”, you refer to and to set the HXCPP_DEBUGGER flag.

So I am still thankful for your proposals.

Kind regards
Arnim

It should be <haxedef name="HXCPP_DEBUGGER"/>, without the D prefixed. -D one the command line stands for “define”.

Thank you, Jens, for your reply.

I have tried that earlier.

But to be save, I have tried it again. That throws an error as well (I think I have documented the error above).

I have also tried all imaginable variations:

  • <haxedef name=“HXCPP_DEBUGGER”/>
  • <setenv name=“HXCPP_DEBUGGER” />
  • <haxeflag name="-D" value=“HXCPP_DEBUGGER” />

Do you have positive experiences in debugging a C++ target with IntelliJ and the haxeToolKitt plug-in?

No, sorry, I don’t use IntelliJ myself (for Haxe at least). I just jumped in when I saw your incorrect <haxedef>. :slight_smile:

But thank you anyway.

So I would like to repeat the question:

Eric, do you mean the Project Structure/ Modules/ Haxe/ Project Macros?
(see my reply #27)

Hi Arnim,

Eric, do you mean the Project Structure/ Modules/ Haxe/ Project Macros?

Yes, that is what I mean. Your screen shot shows that you have already set the value correctly.

Now, I don’t read German, but I think your linker (not your C++ compiler, but part of the compiler’s tool chain) is telling you that it can’t find the symbols in order to complete the linking process and create an executable; essentially functions that are being called are not available. So, somehow the hxcpp-debugger library either isn’t being compiled or isn’t available on the linker’s path.

Do you get the same errors when you build via the command line?

-Eric

Hi Arnim,

Can you give us a screen shot of the “Dependencies” tab for your project?

And also one of the Project Structure/Libraries/hxcpp-debugger library?

-Eric

Hello Eric,

here are the screenshots:

Meanwhile I have tried compilation with an added HXCPP lib. But this didn’t change anything…

Do you mean like this:

C:/…currentDir > C:/HaxeToolkit/haxe/haxelib.exe run lime run E:_IO\HAXE_zzzExperimentalProjects\debugging\project.xml windows -verbose -Ddebug -debug -args -start_debugger -debugger_host=localhost:6972

This returns an apparently correct result:

<LIME logo in ascii art>

Lime Command-Line Tools (6.2.0)

Initializing project…
_Using project file: E:\_IO\HAXE\zzzExperimentalProjects\debugging\project.xml
Reading Lime config: C:\Users\loxog.lime\config.xml
Using target platform: WINDOWS

Running command: RUN
- Changing directory: Export/windows/bin/
- Running command: debugging.exe -start_debugger -debugger_host=localhost:6972 -verbose -livereload
Main.hx:77: variable01: 13
Main.hx:78: variable02: Great
Main.hx:79: variable03: 1.3
[lime.app.Preloader] Preloading asset library
[lime.app.Preloader] Loaded asset library [1/1]
[lime.app.Preloader] Preload complete

And the compiled application opens.

… but I am not sure, if you meant that.

Hello Eric,

I have another idea.

If you do not find the cause by the screenshots, how about setting up a complete helloWorld module for debugging C++ which only includes some variable declarations, the #if debug code snippet and the correct Project Structure (plus debugger/ run settings)?

When you put the project incl. the .idea folder on git hub, I have a working positive. Then I can figure out, what I have done wrong. And I even can have your example be compiled. If your example does not work on my mashine, we at least know, that there is a more fundamental distortion to look for.

Kind regards
Arnim

Hi Arnim,

Do you mean like this:

No. That is running the application that was built (at some point in the past), not building the application, which is where you are getting issues now. Failing to build stops IntelliJ from running. To duplicate the commands that IntelliJ uses, you need to run the lime update ... and lime build ... commands to completion before running lime run.

how about setting up a complete helloWorld module for debugging C++

Excellent idea. I will do that.

-Eric

Thank you, Eric. I am looking forward inspecting a clean solution, even though I am afraid to discover that the probably tiny mistake I have done might be embarassingly stupid…

But I’ll tell you the flaw in my setup anyway. Then we have a complete solution path even for others who stumble over the same issue.

Where can I download it from?

Hi Arnim,

I got started on it this morning. I’ve got an interesting issue in that the debugger starts up, makes the handshake, and then starts again, the second time it can’t get to the port and so hangs with the same message you are getting. I’m not sure why this is, but stay tuned… I’ll figure it out in the next day or so.

-Eric

Hello Eric,

thank you for giving me a feedback about the intermediate result.

Kind regards
Arnim