Suitable Workflow For Debugging C++ Within IntelliJ?

Hello Community,

does anybody know a good documentation for a suitable workflow of debugging a HAXE/ C++ application within IntelliJ?

I want to try out something more sophisticated than my rudimentary “crafting” measures.

I only find old stuff from 2012 that either does not work anymore or is even more complicated than the methods I am actually using.

Thank you in advance.

Kind regards
Arnim

Hello Arnim,

The documentation, such as it is, for debugging targets using the IntelliJ Haxe plugin is here: Debugging - IntelliJ-Haxe

I can help you work through the issues you are seeing. As you ask your questions, I will take them as hints on how to improve the documentation. Once you get past the initial startup, the debugger works well.

The main thing to note is that the plugin does not use the current hxcpp-debugger protocol. It uses an earlier one, and you have to check that out explicitly. See the docs I referenced above. The command you need is:
haxelib git hxcpp-debugger <your_local_clone> protocol_v1.1.

Let me know how else I can help.

-Eric
(IntelliJ-Haxe developer)

Hello Eric,

thank you very much for your answer. I will use it the next time, when I have the next debugging run.

But before that, there is a consideration I want to share with you.

The HAXE community is great. Every question is answered respectfully. But maybe we can develop an optimization of the communication process.

Documentation and communication is in fact an issue within the IT-branche. You find anything for everything. But the quality of information differs a lot. That is not the fault of the person, who offers his knowledge to a broader public.

It is rather a structural problem.

We experience an aging of information in the web. Very often the results of a google search is not valid anymore, links lead to nirvana or articles refer to pre-historic software versions. Also think of an unmaintained git-hub account…

Also it occurs that you find a promising tutorial, but it assumes that the audience has a certain common (“basic”) knowledge, which is not necessarily granted considering the variety of technical solutions and workflows available.

Wouldn’t it be great to develop a communication system, that allows posing questions, where they occur (within the online tutorial) and to optimize the communication process and knowledge sharing with specific tools?

This tool also could allow contributer to automize their workflow creating the tutorial.Tools lilke this could be combined with the online tools, that haxe.org already uses.

If we manage to structure our knowledge more efficiently and easier to access, HAXE would be more attractive even for beginners.

I think, that social-media-based communication-systems beside of forums (which are also great anyway) can help us with that.

I know: If, when, why, what…

Certainly no-body has the time to develop that.

But at least let us keep that in mind. Maybe there will be a way someday.

Kind regards
Arnim

Hello Eric,

I am sorry.
I have tried for hours. But my understanding of your documentation still has gaps.

I have to ask you once again.

I do not understand the step

Configure your haxe program to start the debugger when the following command line option is provided…”

It is supposed to be done with haxelib via lime, right? As you say in the following line:

C:/HaxeToolkit/haxe/haxelib.exe run lime run C:/temp/issue349/openfl_cpp_debug/openfl_cpp_debug/project.xml windows -verbose -Ddebug -debug -args -start_debugger -debugger_host=localhost:6972

Where do I get “openfl_cpp_debug” from?
Or is it supposed to be a placeholder for my project?
Why does your set-up of the project differ from a set-up of a lime-.project?
Does your project include lime anyway?
If not, why is it mentioned in the haxelib line?

I am aware, that I need a graphical support from openFl/ lime to have the debugger be displayed within the GUI of IntelliJ. So some steps explain themselves implicitely. But some steps require other steps, not explicitely mentioned here.

And as I haven’t worked with lime yet and as the lime documentations that I found do not offer a complete workflow from A-To-Z, I feel relatively helpless.

Thank you for taking the time.

Kind regards
Arnim

Hi Arnim,

It seems like the disconnect is this: The hxcpp debugger is NOT part of Haxe runtime or IntelliJ (or Lime or openfl); it is its own library hxcpp-debugger. For the functionality to be included in your code, you have to reference it, and you have to start the debugger via code from within your program. (Otherwise, IntelliJ starts its half of the debugging session and waits for the app, which never connects.) That is what the block of code in the documentation does. It should be the very first thing that your program does (e.g. in static function main()), so that the debugger can help you as early as possible.

It is supposed to be done with haxelib via lime, right? As you say in the following line:

C:/HaxeToolkit/haxe/haxelib.exe run lime run C:/temp/issue349/openfl_cpp_debug/openfl_cpp_debug/project.xml windows -verbose -Ddebug -debug -args -start_debugger -debugger_host=localhost:6972

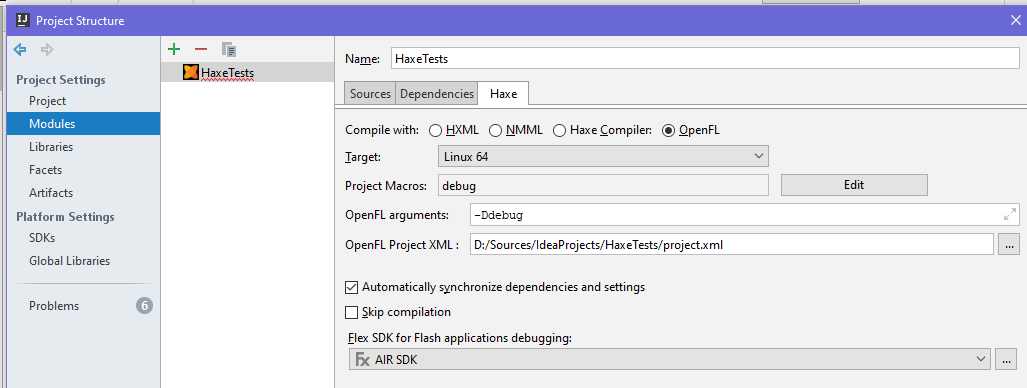
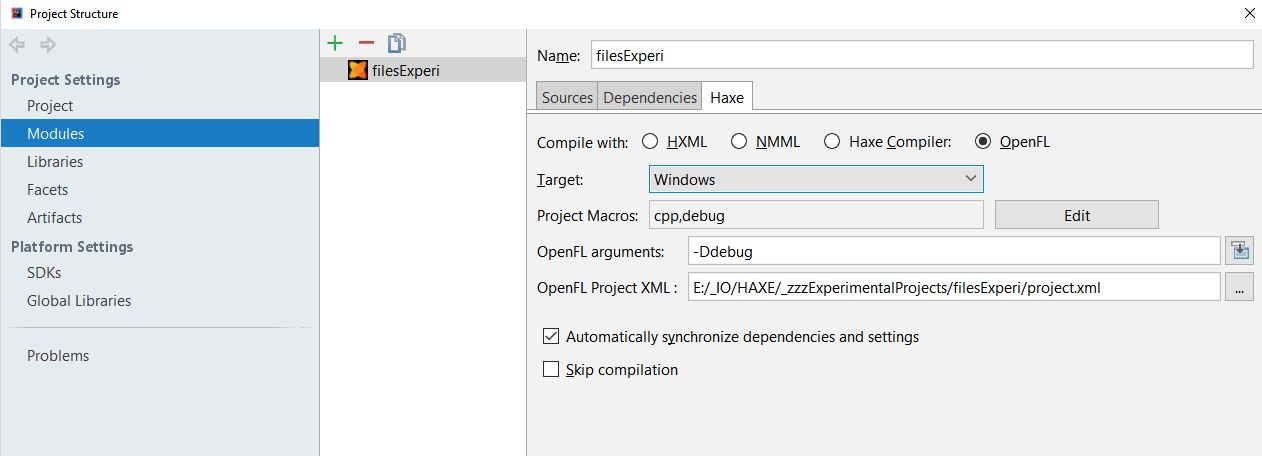
That command is generated for you, with the proper directories to run your project. (The path c:/temp/issue349/openfl_cpp_debug/openfl_cpp_debug/project.xml is the path to the project.xml that you specify in your module configuration tab (File->Project Structure…->Modules(left panel)) OpenFL Project XML field.

Where do I get “openfl_cpp_debug” from?
Or is it supposed to be a placeholder for my project?

Those are placeholders from your project. See the image above.

Why does your set-up of the project differ from a set-up of a lime-.project?

As shown above, this is the standard way to set up an OpenFL/Lime project in IntelliJ.

Does your project include lime anyway?
If not, why is it mentioned in the haxelib line?

The lime command is always used (actually haxelib run lime ...) for commands to run and/or build OpenFL projects.

I am aware, that I need a graphical support from openFl/ lime to have the debugger be displayed within the GUI of IntelliJ.

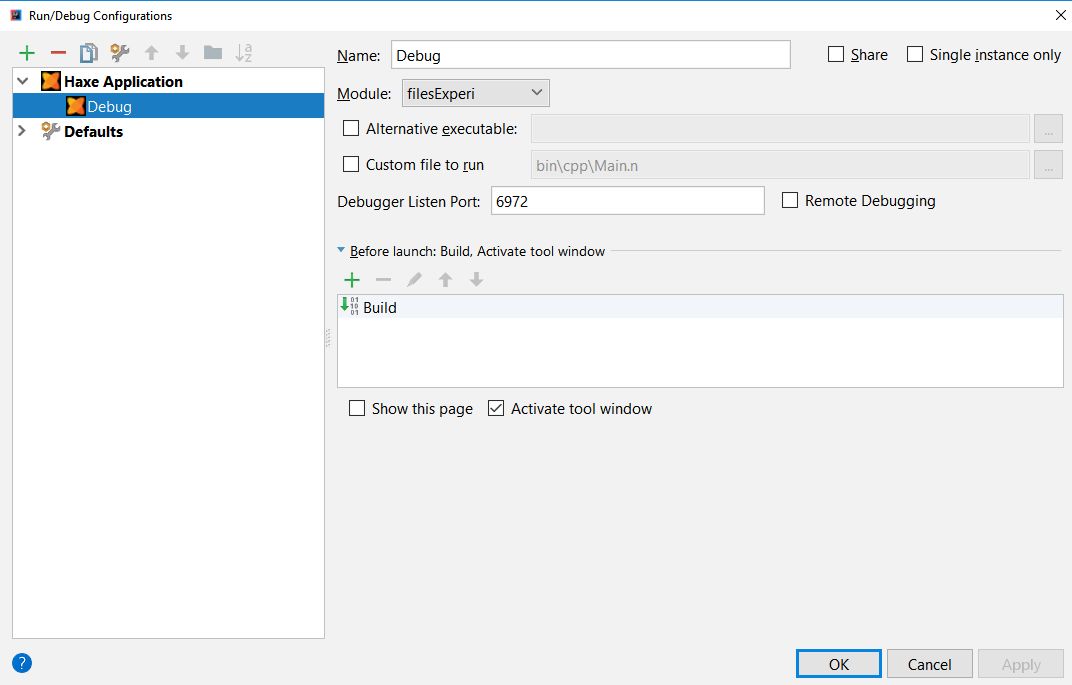
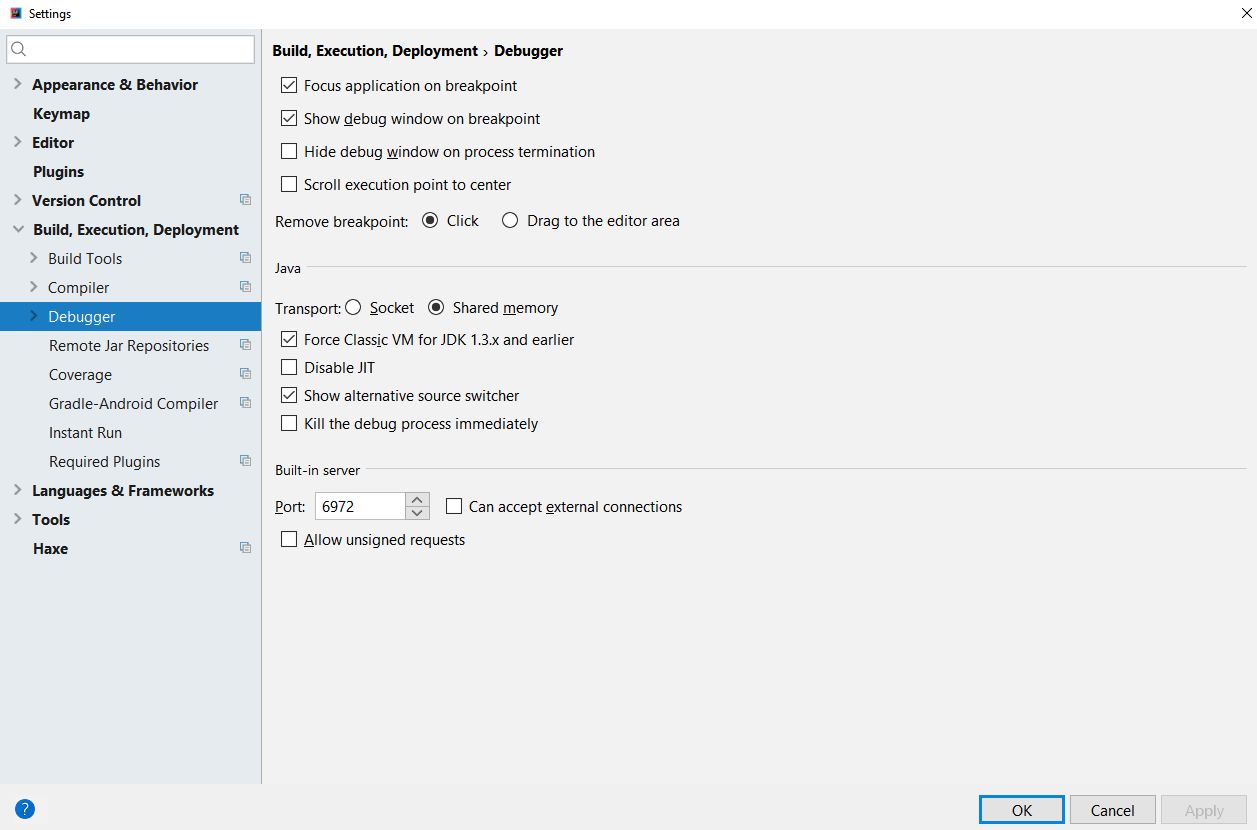
That is incorrect. You need support from the hxcpp-debugger library – specifically, you must call new debugger.HaxeRemote(true, hostname, port); to start the debugger. That will start up a couple of debugging threads and connect to IntelliJ for control commands (run, step), breakpoints, etc… IntelliJ will tell your program – on your program’s command line – what the hostname and port to connect to are, since it is in control of them (and you can set the port explicitly in the Run->Debug…->Edit Configuration dialog). The only difference between “OpenFL” and “Haxe Compiler” type projects is whether haxelib run lime ... or your_program_name, respectively, is used as the executable.

And as I haven’t worked with lime yet and as the lime documentations that I found do not offer a complete workflow from A-To-Z, I feel relatively helpless.

Well, Lime doesn’t really have anything to do with the debugger, so I don’t expect them to have much information. Plus, Joshua (the main author of OpenFL and Lime) doesn’t use IntelliJ IDEA, so he has very little reason to research and document it.

Be of good cheer, though. There are many in the community that use and rely upon this debugger every day. We will get you there!

-Eric

P.S. It might be simpler to ensure that you can build and run a very small program in OpenFL before you start trying to use the debugger. Then you can be sure that OpenFL and Lime are not part of your problem.

Hello Eric,

thank you, for taking the time again. And a very big ‘thank you’ for giving me such a detailed answer. I agree to you, that I first should get familiar with openFl.

So this will keep me busy for a while…
:wink:

Kind regards
Arnim

Hello Eric,

guess what…

I am sorry. I hope that you believe me, that I was digging deeply, to get the information needed to solve the problem on my own. In vain…

The following line (among others) occur when I start the debugger:

Information:Running command: C:/HaxeToolkit/haxe/haxelib.exe run lime build E:/_IO/HAXE/_zzzExperimentalProjects/filesExperi windows -verbose debug -Ddebug -args -start_debugger debugger_host=localhost:6972

Some lines below the mashine tells me, that the command ‘build’ (and the commant ‘update’) do not have the correct amount of arguments.

How can I change the lines to the correct run command (“…haxelib run lime run…”)?

I have setup the compile option within the Project Structure with openFl project.xml and the arguments that are supposed to be handed over to the compiler to start the debugger. And I also have setup the debugging configurations

I even have looked, if I find the run command within any lateral project file either within the .idea folder or the project.xml/ .hxproj to correct it manually (no result).

The .hxproj contains the command ‘… run lime run’, but this is the correct one, that does not need to be corrected…

I am sorry, to ask for your time again.

Kind regards
Arnim

Hi Arnim,

No apologies necessary. I am happy to help.

How can I change the lines to the correct run command (“…haxelib run lime run…”)?

The default setup for a “Run” or “Debug” configuration contains the sub-command “Build.” That sub-command runs ‘lime update’ and ‘lime build’ commands. Only when that completes successfully does the ‘lime run’ command get executed. So, to get to ‘lime run’ without a build, you need to remove that sub-command by highlighting it and then pressing the ‘-’ icon above it.

That said, I wouldn’t do that.

Instead, let’s figure out why your builds are failing… Can you please post the actual output of the messages pane in which you are getting the error? Also, can you please post a screen capture of the Project Structure->Module->Haxe tab?

I have setup the compile option within the Project Structure with openFl project.xml and the arguments that are supposed to be handed over to the compiler to start the debugger. And I also have setup the debugging configurations…

This might actually be the cause of some of your problems. The debugger options (-start_debugger and -debugger_host) are supplied to your program by the plugin. You should NOT specify them in the compiler arguments. Just removing them may get you past the build issues, but, if not, I’ll take a look at the images and text that you post.

Don’t lose hope.

-Eric

Hello Eric,

Don’t lose hope.

Never ever. My only concern is, that I could exhaust the patience of my fellow-HAXE-developers.
:wink:

So thank you very much for your patience and help.

I will work on the solution later on, as I have to prepare some matierial for the re:publica that is about to start soon.

The re:publica is a convention where nerds like me (and like anyone who feels addressed by the term ‘nerd’ :wink: ) discuss the social implications of modern technology. It is very sophisticated. And very renowned players of the fields IT-Branche, Politics, Journalism (and further more) are speaking and networking there.
It’s very exciting.

Maybe you have already heard of it (it’s becoming more and more popular).

I am afraid, that I will have to ask you again for help next week.

But of cause, you will also here from me, if I get it working.

Until then. Have a nice weekend.

Kind regards
Arnim

Hello Eric,

I have tried again…

I have even tried to switch on the debug settings “Can accept external connections” and “Allow unsigned requests”.

No effects.

At least I found out, that the built-in debugging server was set to port 63342. I have changed that to the according value.

Here are the screenshots of the project structure, the debug setUp and the settings for debugging…

ProjectStructure:

DebugSetUp:

DebugSettings:

And I am not able to set breakPoints (maybe that’s a hint, why the debugging is still not working yet):

And here is, what the mashine tells me when I copy-paste the haxe-command into the terminal of IntelliJ:

E:_IO\HAXE_zzzExperimentalProjects\filesExperi>C:/HaxeToolkit/haxe/haxelib.exe run lime run E:_IO\HAXE_zzzExperimentalProjects\filesExperi\project.xml windows -verbose -Ddebug -debug -args -start_debugger -debugger_host=localhost:6972

/\\\_____________________________________________
////\_____________________________________________
/\_/\____________________________
/\_////\\_/\\_/\\\\
/\_/\_/\///\\///\___/\/////\_
_____/\_/\_/\_//\_
/\_/\\\\\___
/\_/\_/\_/\_/\_//\///////
________/\\\\_/\_/\_
/\_/\_//\\\\\__
///////////////////////////////_

Lime Command-Line Tools (6.2.0)

Initializing project…
Using project file: E:_IO\HAXE_zzzExperimentalProjects\filesExperi\project.xml
Reading Lime config: C:\Users\loxog.lime\config.xml
Using target platform: WINDOWS

Running command: RUN

  • Changing directory: Export/windows/bin/
  • Running command: FilesExperi.exe -start_debugger -debugger_host=localhost:6972-verbose -livereload
    [lime.app.Preloader] Preload[lime.app.Preloader] Loaded asset library [1/1]
    [lime.app.Preloader] Preload complete
    Main.hx:59: arg: -start_debugger
    Main.hx:59: arg: -debugger_host=localhost:6972
    Main.hx:59: arg: -verbose
    Main.hx:59: arg: -livereload
    Debugger:Starting App side debugger support.
    Debugger:Failed to connect to debugging server at localhost:6972: Eof
    Debugger:Trying again in 3 seconds.

(The error endlessly repeats, as the debugger obviously can’t connect to debugging server)

Kind regards
Arnim

(The error endlessly repeats, as the debugger obviously can’t connect to debugging server)
Right, because running the command from the terminal does not place IDEA into the debugging mode.

Which version of IDEA are you running? Debugging doesn’t work with the Community Edition. It requires IDEA Ultimate (or an EAP of Ultimate, which you can download and run for free). Whether or not it works is not a function of the plugin, either; IDEA Community Edition simply will not call the plugin’s debugging functionality to start a debugging session.

When you start the debugging session, there should be output to the Console tab in the Debug pane (not the same as a terminal window, though the output will be similar). That output is important and what I would like to see. Also, the sources of the function where you start the debugger would be helpful.

The “Built-in server” section of the Debugger Settings Dialog is not used by the Haxe plugin; only the port number in the “Run->Debug Configuration…” is used.

-Eric

Hello Eric,

now, I feel a little bit embarrassed.

For two reasons:

First of all, I would have mentioned it earlier, that I have used the Community Version. But one of the first things, I have checked, was the comparison between Community and Ultimate. It claimed, that also the Community Version would support debugging. So I thaught, I could exclude that from the list of potential causes…

Secondly, I now have installed the Ultimate Edition. But the same error occurs:


Debugger:Failed to connect to debugging server at localhost:6972 : EOF
Debugger:Trying again in 3 seconds.

I also have considered setting an exception to my firewall/ virus scanner.

It is Avira (a German company).

But I did not find a setting for excluding a port from watching, only for excluding processes. So I set IntelliJ.exe as an exception.

… which is assumingly the wrong one. If this was the reason, probably the debugging server would have been the process to be excluded from watching?

Besides: Avira does not throw any error or warning.

The settings and the project structure is still the same as shown in the snapshots above.

Kind regards
Arnim

UPDATE:

I assume, I have to get the Adobe Air SDK running…

No. That wasn’t it.

So this is the current state:

  • IntelliJ Ultimate 2018.1.2 installed
  • Flex Air SDK installed (and setup in Projekt Structure)
  • Codesnippet #if (debug && cpp)’ implemented in the Main.main()
  • Debug setup to Port 6972
  • … all settings like the screen-shots above (except of the air sdk, which is included now)
  • Debugging attempt via IntelliJ Debug-Button failed
  • Debugging attempt via copy/ paste into the IntelliJ terminal failed

I do not have the slightes clue, what to do else…

You only need AIR if you are debugging a Flash target. You are not.

When you start the debugger, a debug pane should open. In that debug pane, there is a console tab. Capture the output of that console tab and post it.

Also, look at your idea.log (in C:/Users/<user_name>/.IntelliJIDEA2018.1/system/log) for the time you are debugging. If you see errors or stack traces immediately following your starting a debug session, then post those. (Or put them on dropbox or similar.)