edit: I’ve updated the title to indicate post contains a solution despite the question mark
Now that there is a test explorer for VSCode you probably wonder is there a way to somehow show coverage results in VSCode?
Well, I’m glad you asked. Let me get you covered - at least some of you.
Formatter, tokentree and checkstyle all use munit and mcover to run tests and collect coverage results. Each project has a test.hxml that references both libraries and enables coverage macros. We run tests from those test.hxml files rather than using munit’s command line tool. It was almost three years ago that checkstyle started recording coverage on codecov.io using a similar setup to what I’m going to showcase here.
I have no knowledge on how well mcover plays with test frameworks other than munit, so everything in here might apply only to people using munit for their tests.
Usually mcover just prints out coverage results to your console, either in a summary or a more detailed report including a list of each branch that wasn’t covered. While a list in a console window gives you at least some hints on how to improve your coverage, it’s not really that nice and easy to work with.
Luckily there are two additional reporters (or print clients) that you can use to get coverage results into a more manageable form:
- Use
CodecovJsonPrintClientto report coverage data to codecov.io e.g. formatter coverage
Just addCodecovJsonPrintClientto your main test class, just before callingrunon yourTestRunnerinstance, e.g.:
var suites = [TestSuite];
var client = new MCoverPrintClient();

MCoverage.getLogger().addClient(new CodecovJsonPrintClient());

var runner = new TestRunner(client);
runner.run(suites);
You will end up having a coverage.json file in your workspace root - or wherever you run your tests. You can submit that file to your codecov account by e.g. using their bash uploader which will automatically pick up coverage.json.
You might want to run it as part of your CI build job to give you nice coverage results. You can also look at changes in coverage for new commits / pull requests or even between branches. When integrated with your github repository you can see how a new pull request affects your coverage before merge, allowing you to add more testcases so overall coverage doesn’t drop.
Yeah I know, I promised VSCode not somewhere in a cloud. Please hang on.
- Use
LcovPrintClientto visualise coverage data in VSCode
Like with codecov you add a print client to make mcover generate alcov.infofile, which you can then use to get coverage results into VSCode:
var suites = [TestSuite];
var client = new MCoverPrintClient();

MCoverage.getLogger().addClient(new LcovPrintClient("Unittests"));

var runner = new TestRunner(client);
runner.run(suites);
After running your tests a file named lcov.info will appear in your workspace root (or wherever you run your tests). It’s a text file that you can feed into a number of tools that support lcov format. Two of which come in the form of VSCode extensions:
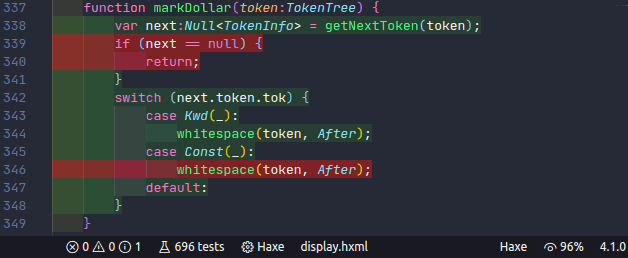
a) coverage-gutters shows coverage results for your current file either in gutter (left, next to line numbers), ruler (right) or per line (a lot of colour right in your code) - or any combination of them (via settings.json). You can see a full set here:
You can toggle coverage-gutters on and off by clicking Watch / Remove Watch in VSCode’s status bar.
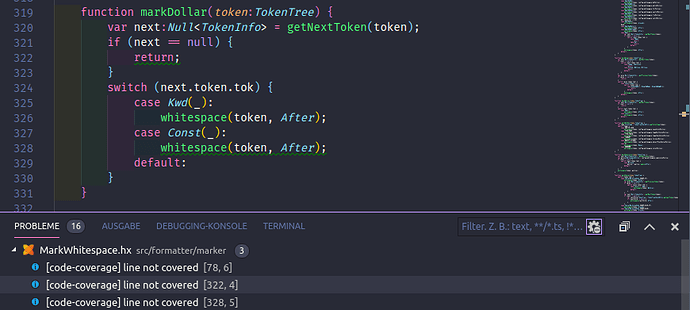
b) code-coverage is a bit less colourful and uses diagnostics to show lines not covered by tests. As a result your problems view might get flodded with entries because each line not covered appears as a separate issue. You can click each entry to jump to it’s corresponding position. Diagnostics show up as squiggly lines in your code.
coverage-gutters and code-coverage both show lines that were not covered during your test run. Additionally coverage-gutters also marks lines that have partial coverage where e.g. an if-branch was covered but tests never hit your else-branch. So it gives you a bit more information especially when you don’t have an else-branch. I suggest you play with both to see which one works best for you.
In previous versions coverage-gutters’ lcov parser was rather slow, taking a long time to read your lcov.info file especially for large projects. Recent versions seem to have addressed that issue.
Please note: For
LcovPrintClientto work with both extensions you need a mcover version above 2.2.1, which currently means a git / dev version. covereage-gutters should work with 2.2.1, but code-coverage needs a more recent version, that generates absolute file paths before showing coverage.
Current git version also handles coverage data of multiple classes in the same file.


